Last year, I carved a lot of time out of the class for students to define their own projects (around 40% of the course). For a variety of reasons, I plan to cut back on that open time, but I will build in some of the better ideas into the core curriculum. One idea that students had a lot of fun with was a "would you rather" survey of seniors at school that they turned into a visually appealing infographic (click to enlarge):

As a kick-off activity on the first days of class, I like to do some kind of simple survey using Google Forms to get students used to the idea that questions are variables (the response set), these variables come in different forms (most notably quantitative and categorical, but also ordinal and qualitative), and people are individuals (which are the rows in a spreadsheet). I think this would still make a good opening activity, but now we would start a questioning each part of the rushed process after we finish:
- Who did our data actually represent? If we did a convenience sample of most of our class, it hardly even represents the class well, let alone the school or all US high school students. What if you wanted to talk to the same number of people and yet say that your data represents student opinions from across the state? This would require a better understanding of population and samples, instruction on sampling methods, and a better foundation in randomness (all of which are where I would insert my videos, a lecture, or a mini activity to instruct on these needed stills).
- How effective was the presentation of the data? Did you share everything or select only the most interesting graphs? Did you break any graphs down based on conditions or only look at overall answers? Did the audience find it visually appealing and interesting to look at? Does the presentation of the data deceive or dance around any issues? What other ways could your data be presented visually?
- How well did you communicate the uncertainty in your results? Does 75% mean exactly 3 of 4 or is there a margin of error? Where does that margin of error come from? Does it account for bias in question wording, questioning technique, or sampling method? Could you find a confidence interval on your first survey data, and why / why not? Can you explain in only a few characters on an infographic what your confidence interval tells you?
This would lead to a new (or simply refined) survey project where students generate a set of 5-8 questions that they find interesting, limiting themselves primarily to 2-option multiple choice questions (would-you-rather questions work great for this) and quantitative response questions. Scale questions (rate from 1-5...) are technically not quantitative because the difference between 1 and 2 may not mean the same as the gap from 2 to 3, plus the numbers are usually more subjective, but they work well (somebody please convince me they are okay or not okay). Otherwise counting how many days/week or times/day a person does something works too.
To collect the data, we would probably use a school-wide random sample stratified by grade (gender would be nice too, but it is harder based on the lists I get access to). Instead of having many groups annoy every classroom, we would try to consolidate all of our questions into one or two surveys and split up the randomly selected students. We would only decide this after class discussion and consensus, so they might choose a different method if it works well (like regular SRS).
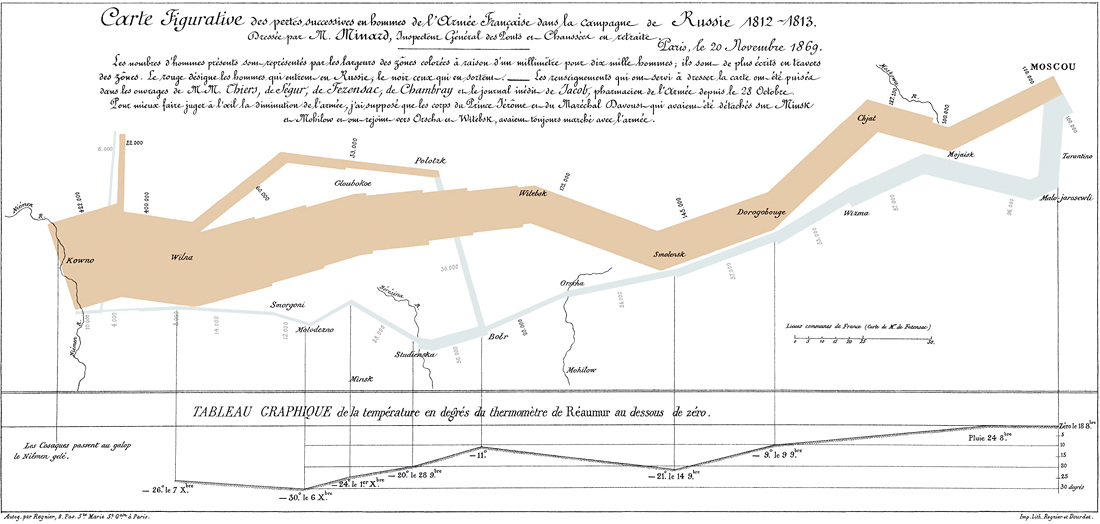
With data in hand, I plan to teach mini-lessons on data presentation, learning primarily by example and discussion. We would start with traditional graphs like stem plots, box plots, histograms, dot plots, bar graphs, and pie graphs, making sure we use the right ones for the type of data / size of data set, and discussing how they could be extended or improved to be more visually appealing (such as making the bars some kind of image or filling in a proportion of an image instead of a pie graph). To push students beyond the basics and force them to think more creatively, this would definitely include my favorite graphics of all time: Death and Taxes and Napolean's March (both below, click to enlarge if you have a ton of time to kill, because if you read my blog, you're nerdy enough to stare at them for hours).

In addition to visual summaries, we like to summarize data in numbers. Categorical data gets boiled down to a proportion while quantitative data gets a lot more complex as you describe multiple measures of center and spread and consider both in the context of its shape. Discussing the tradeoffs between mean and median and using case studies where students defend which statistic is the better summary could set up a nice baseline before they start throwing numbers all over their infographics.
Before students get too carried away with how they will present their graphs and summary stats, we need to spend time learning about the limits of our precision. Connecting back to sampling, we can simulate in class the idea of taking an SRS of the same population multiple times with varying results, eventually getting to the big question -- is the average and variation predictable? After a few time-consuming in-class simulations, we can take a trust leap into a computer simulation (I like StatKey). Thousands of iterations reveal that there is in fact pattern and order to the means of the simple random samples, allowing us to say how confident we are that any one sample fell within a certain range of the true population mean. I plan to get deeper into inference in the next unit, so just introducing the idea that uncertainty is predictable should be mind-blowing enough for now.
As we work through all of these components in class, there will be a few individual assignments and checkpoint quizzes (probably multiple choice for instant grading and feedback) to make sure all students are learning the core material. If a student does not score 80% or better on the quiz, they will need to meet with me individually or in a small group before their group can turn in any shared assignments (thanks to Kris @KHaeussinger for that idea). This adds individual accountability and a check that the supporting content is being taken seriously and making sense. Beyond that, students will spend most of their time working on their infographic project in teams of 3 that I create at the start of the unit (based on experience as a student and as a teacher, 3 just seems like a magic size for most things). As we get about halfway through the unit, I want teams to start to give each other feedback. There are structured formats for this such as a gallery walk or critical friends that should be used to quickly generate constructive ideas instead of "oh yeah that looks great".
The final product is a large color poster for display in the halls of the school. To share them with the class, we would hold a poster session where one teammate stays back and two float to see other posters and listen to mini-presentations. Rotate 3 times and everyone would both present and watch. I would float and ask questions / assess the final product (pulling in the floating team members when I'm present at their poster).
WHEW. That was a lot longer than I expected...I guess I had been giving it some subconscious thought for a while. That said, none of this is set in stone and I want it to be awesome, so please point out the areas that could be stronger or got overlooked and I look forward to incorporating your feedback. Shoutouts to Megan @veganmathbeagle and Dianna @d_hazelton for helping me think through some of this and pushing me to write it down. Besides ideas for seniors, it will be awesome to hear what this might look like for 9th graders / non-seniors as well.
I like the idea of starting out the class by having students collect data that interests them. I feel like this will hook them into the class. I will definitely try something like this for my classes, we will have to discuss the results. I genuinely agree that the students will be more engaged with the projects that you've outlined. Thank you for sharing your ideas!
ReplyDelete